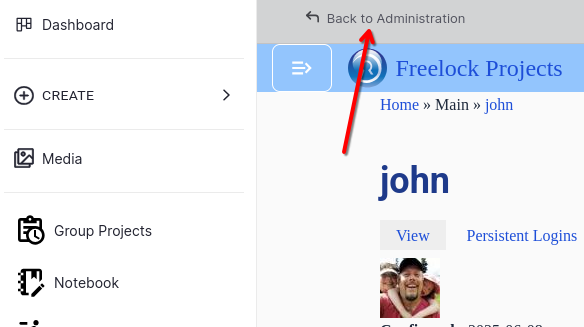
So we just hijacked #Drupal Core's experimental Navigation module to add a couple menus and make them available inside our Drupal-based PM/CRM system -- and while it still needs some tweaking, it's a big UX improvement for us.
But... now there's this weird top strip with a link, "Back to Administration" that for most users goes to a 403 page. Where would I file an issue for this?
@mradcliffe Thanks for digging this up! I did successfully add it directly to the config, copying from a vanilla Drupal CMS install, and got the dashboard link to show up.
@opdavies Glad to hear you like it!
I'd absolutely love to discuss further on your podcast. I did reply to you a while back in Slack, we can coordinate a time there...
New blog post: Website Availability - handling an outage https://www.freelock.com/blog/john-locke/2025-06/website-availability-handling-outage #Drupal #hosting #downtime
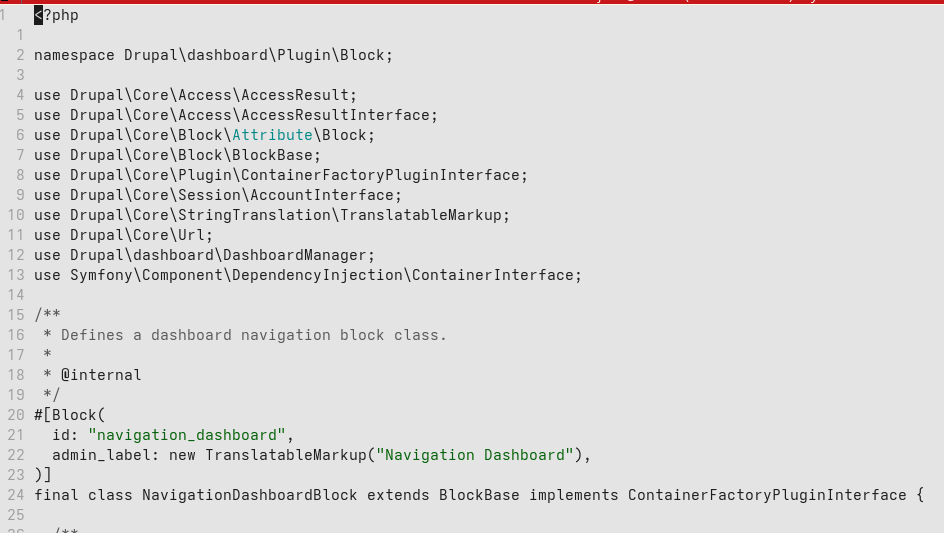
@mradcliffe Block plugin is in dashboard module... question is, why isn't it placeable?
I did manually edit that config, copying over the section from a vanilla Drupal CMS install
Hijacking the experimental #Drupal navigation module's menu to provide navigation for our PM system.
The result is looking good, not perfect. But the strangest thing is the "navigation_dashboard" block doesn't show up anywhere to place it. It's a normal block plugin, and it's there when you install Drupal CMS -- but to get it to show up, I had to hack the block into the config file and import. Anyone know why?
@opdavies I would love to hear more about using Nix with composer, and how to make https://drupal.org/project/drupal_flake better!
I just tried using #AI to identify the cause of a monitoring system failing to alert on a customer outage, and managed to track it down.
Out of curiosity, I tried exactly the same prompts across Claude.ai, DeepSeek, ChatGPT, and Perplexity.
DeepSeek won, with the best, most succinct plan to fix the issue! Claude wasn't bad. ChatGPT was confusing, and Perplexity mostly got it but TMI...
Upgrading a Drupal 8 site, and needed PHP7.4 to get it running locally. So I just got that working in Drupal-Flake (https://drupal.org/project/drupal_flake). #drupal #nix
Wild stuff! https://www.pentestpartners.com/security-blog/exploiting-copilot-ai-for-sharepoint/ #AI #Security
New blog post: Sustainable Business and AI https://www.freelock.com/blog/john-locke/2025-05/sustainable-business-and-ai #Drupal #AI #OpenSource
Looks like MastoFeed.com forget to renew their domain registration. Anybody have a quick easy way to embed a #Mastodon timeline on a website?
New blog post: Containerless Dev environments for Drupal development with Nix https://www.freelock.com/blog/john-locke/2025-05/containerless-dev-environments-drupal-development-nix #DrupalCon #Nix
Gotta love #NixOS... A #Prometheus update broke a bunch of panes on our #Grafana monitoring screens.
I checked out an older flake.lock and switched to that configuration, and all my metrics are back as they were before!
@laird Yeah the metrics in the queries all come up with "Empty query result".
I verified the metrics are still showing up in the target exporters -- but Prometheus seems to be ignoring them?
These metrics in particular:
node_network_transmit_bytes_total
node_filesystem_avail_bytes
node_filesystem_size_bytes
container_memory_usage_bytes
So after upgrading #Prometheus from 3.1.0 to 3.3.0 (nixpkgs), suddenly my Grafana dashboard is missing data for several panes related to network traffic and disk usage. I see the underlying metrics are still visible in the node exporter data, but not in Prometheus. Not seeing anything obvious in the change logs -- what am I missing?
New blog post: Ask Freelock: Do I need a Web Application Firewall? https://www.freelock.com/blog/john-locke/2025-04/ask-freelock-do-i-need-web-application-firewall #WordPress #Drupal #WAF #Security

